

Nu Holdings: The Purple Card and the $74 Billion Machine

In 2013, David Velez walked into a Sao Paulo branch of one of Brazil’s big five banks to open an account. He was a Stanford MBA, a former Sequoia partner, a man who had navigated Silicon Valley fundraising. The branch required him to pass through a security airlock, show multiple forms of ID, and wait. It took weeks.
He was stunned, not by the inconvenience, but by the opportunity hiding inside it.
Brazil’s banking system was, at the time, one of the most concentrated and profitable on earth. Five banks controlled roughly 80% of the market. Interest rates on credit cards routinely exceeded 300% per year. Fees were opaque, service was hostile, and an estimated 40% of the adult population had no formal banking relationship at all. Not unbanked by poverty, but unbanked by design. The system had decided that small customers were not worth serving.
Velez founded Nubank on one insight: if you removed the branches, the legacy IT, the paper forms, and the hostile friction, you could serve those customers profitably at a fraction of the cost. You could do it digitally. And you could make the product desirable, not just tolerable.
That last part turned out to be the key.
The purple card: matte, physical, numberless on the front, yours within minutes of a phone application. It became one of the most coveted objects in Brazilian consumer culture. Not because it was premium. Because it was different. It was the card that said your big bank doesn’t own you anymore.
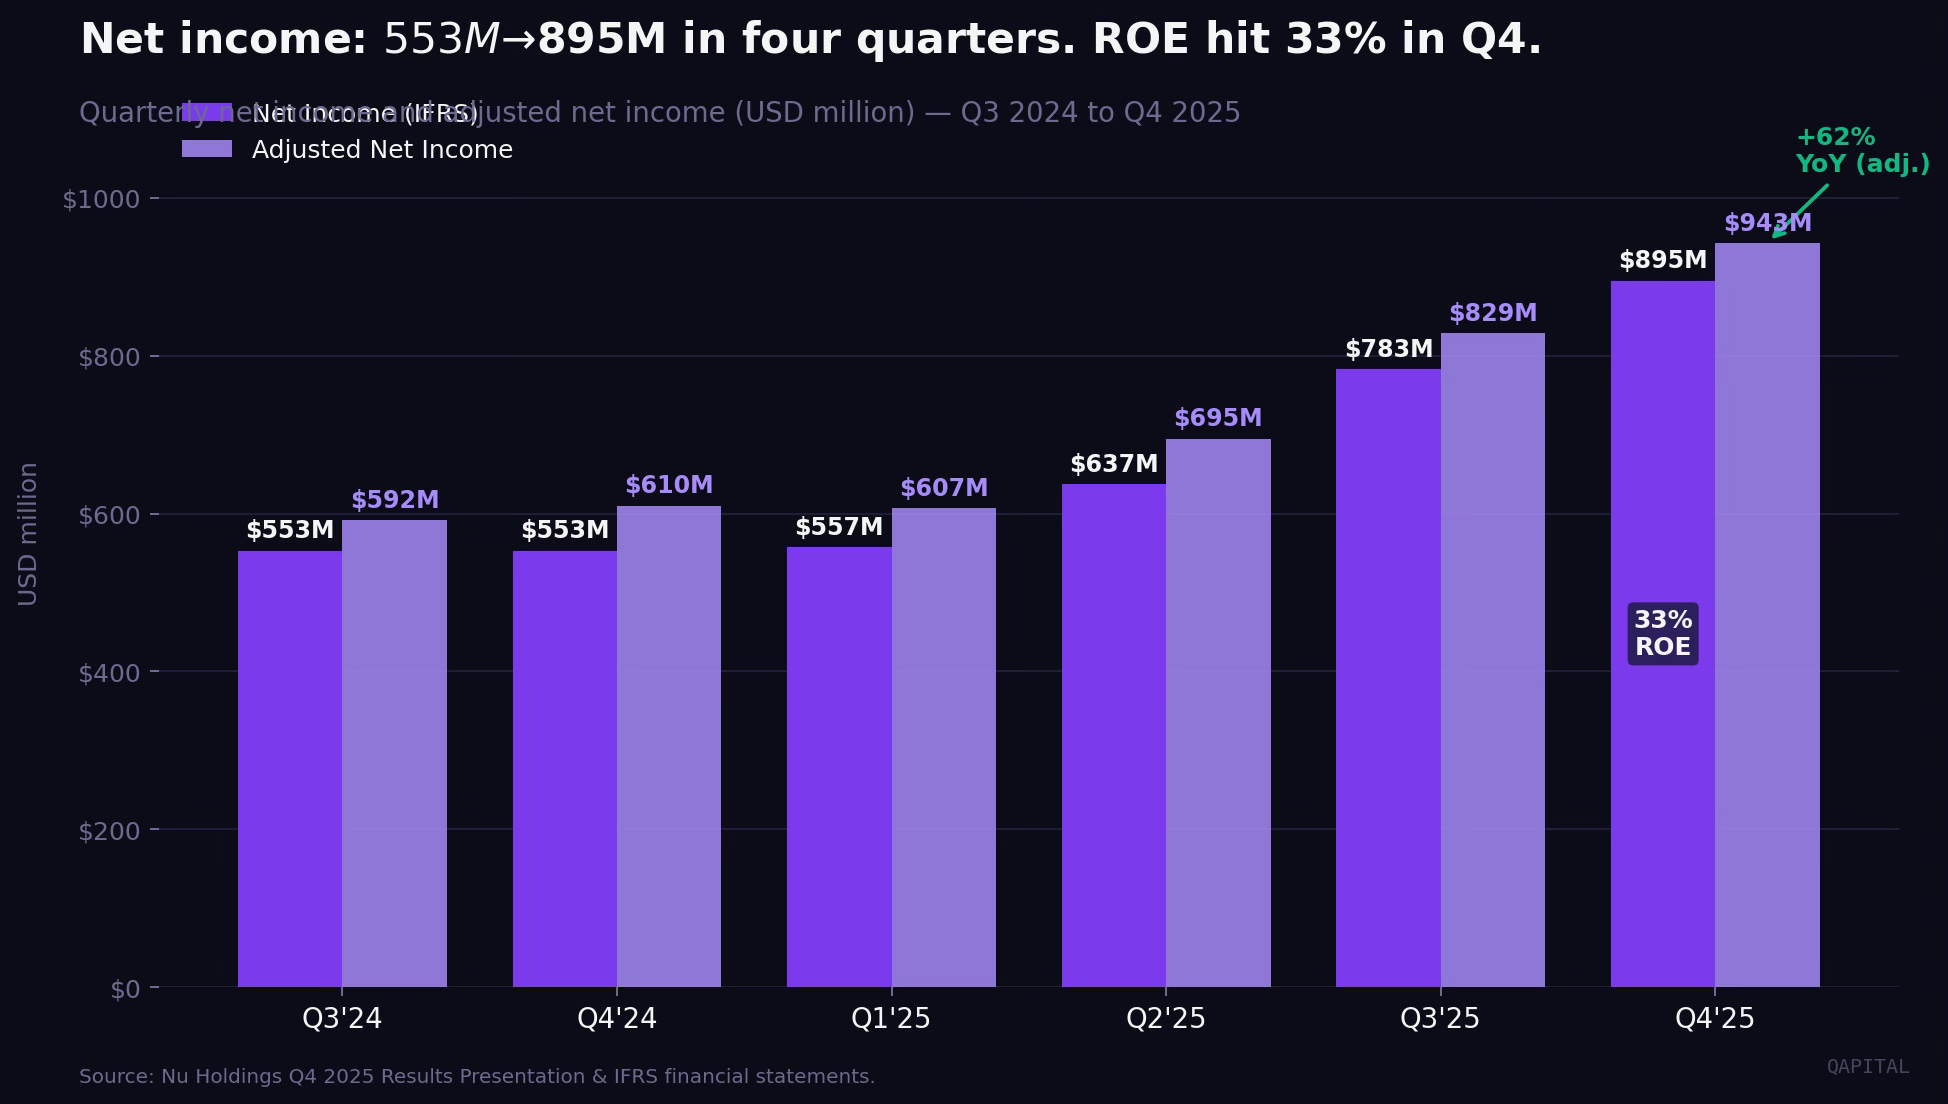
Twelve years later, Nu Holdings serves 131 million customers across three countries. It generated $2.87 billion in net income in 2025, up 46% year-on-year. It has broken below a 20% efficiency ratio, a level most US banks have never reached. Its return on equity is 33% and rising.
And it is about to attempt what no LatAm fintech has seriously tried: building a full-service retail bank in the United States.
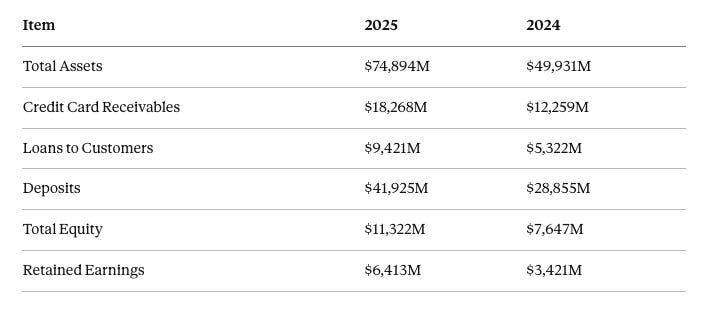
This is the story of how a purple card became a $74.9 billion balance sheet (total assets at year-end 2025), and whether the machine can keep compounding.
The Business: What it is and how it makes money
Nu Holdings is not a payments app. It is not a neobank in the narrow sense. It is, increasingly, a full-service digital retail bank with one structural advantage its legacy competitors cannot replicate: it has no branches.
The customer journey is entirely digital. You download the app, you apply, and within days (sometimes hours) you have a credit card, a current account, a savings vehicle earning close to the interbank rate, and access to personal loans. No branch. No account minimum. No monthly fee on the core product.
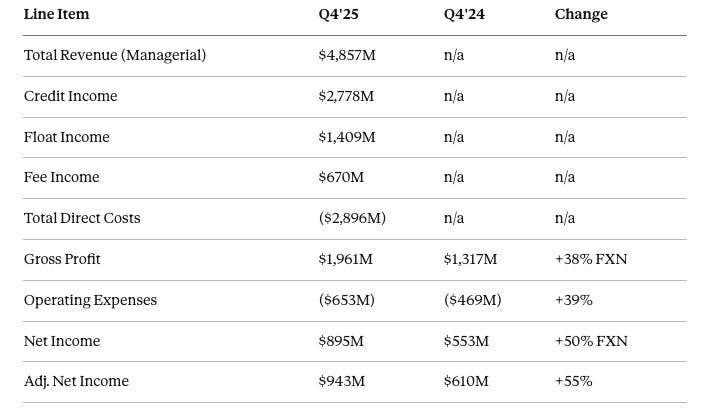
The business generates revenue across three streams, now formally disclosed under the new Managerial P&L framework introduced in Q4 2025. These segments are managerial classifications that differ from the IFRS income statement line items, but they offer a cleaner view of how value is created:
• Credit Income ($2,778M in Q4’25, managerial basis): the core engine. Interest charged on revolving credit card balances, personal loans, and secured credit products. This is the largest revenue driver, representing 42% of gross profit. As Nu extends more credit to existing customers and moves them up the risk-and-reward curve, this line compounds.
• Float Income ($1,409M in Q4’25, managerial basis): the structural advantage of holding deposits. Customers keep their money in Nu accounts because they earn close to 100% of the Brazilian CDI (interbank rate) on their balances. As of Q4’25, Nu’s cost of deposits runs at approximately 87% of the interbank rate. It takes in $41.9 billion in deposits. This line has grown from 18% of gross profit in Q3’24 to 29% today, a meaningful mix shift toward a lower-risk, higher-quality earnings stream.
• Fee Income ($670M in Q4’25, managerial basis): interchange, insurance, investment product fees, marketplace commissions. At 29% of gross profit, it represents a real and growing monetization layer.
On a managerial basis, gross profit in Q4’25 was $1,961 million. Full year 2025 gross profit on an IFRS basis was $6,625 million, against total IFRS revenues of $15.8 billion and expected credit losses of $4.2 billion for the year, implying a gross margin of approximately 42%. This is a bank earning tech-company-grade gross margins.
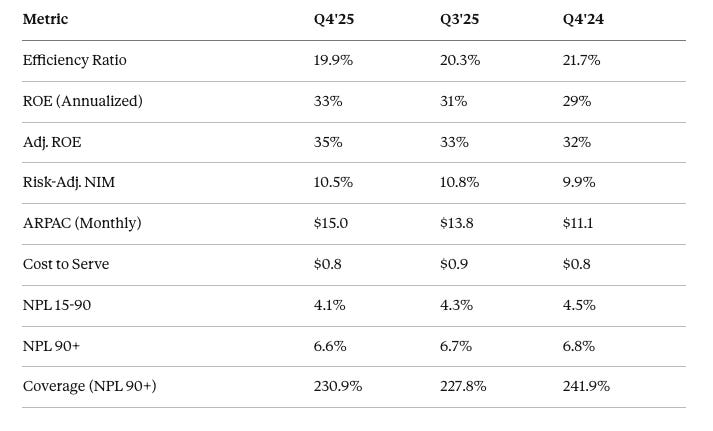
The structural reason is the cost base. Nu has no branches. The cost to serve one active customer per month in Q4’25 was $0.80. Monthly revenue per active customer was $15.00. That is an 18.75x revenue-to-cost ratio. Cohort data from the Q4’25 presentation shows a customer at month 96 (eight years in) generates $30.20 per month in ARPAC, 38x the cost to serve them.
The operating leverage this creates is extraordinary. The efficiency ratio (operating expenses as a percentage of net revenue) fell to 19.9% in Q4’25, breaking below 20% for the first time. For context, see the peer comparison below.
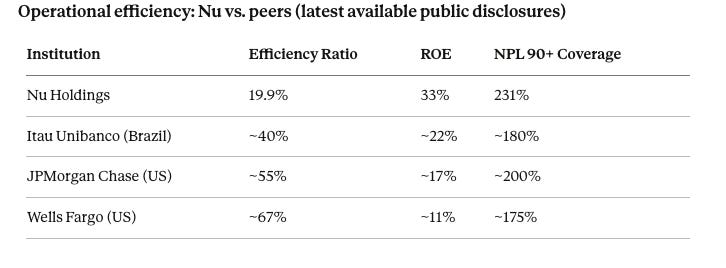
Nu is running a bank at roughly one-third the operating cost ratio of its global peers. This is the structural advantage that cannot be replicated by an incumbent with a legacy branch network and headcount base.
The Unit Economics: What each customer is actually worth
The cohort slide from the Q4’25 results presentation is the most important chart in the entire Nu Holdings story. It deserves to be read carefully.
A customer acquired today generates $0.80 per month in ARPAC in month one. By month 12, that is $4.80. By month 24, it is $7.40. By month 48, $12.30. By month 96 (eight years into the relationship), it is $30.20 per month.
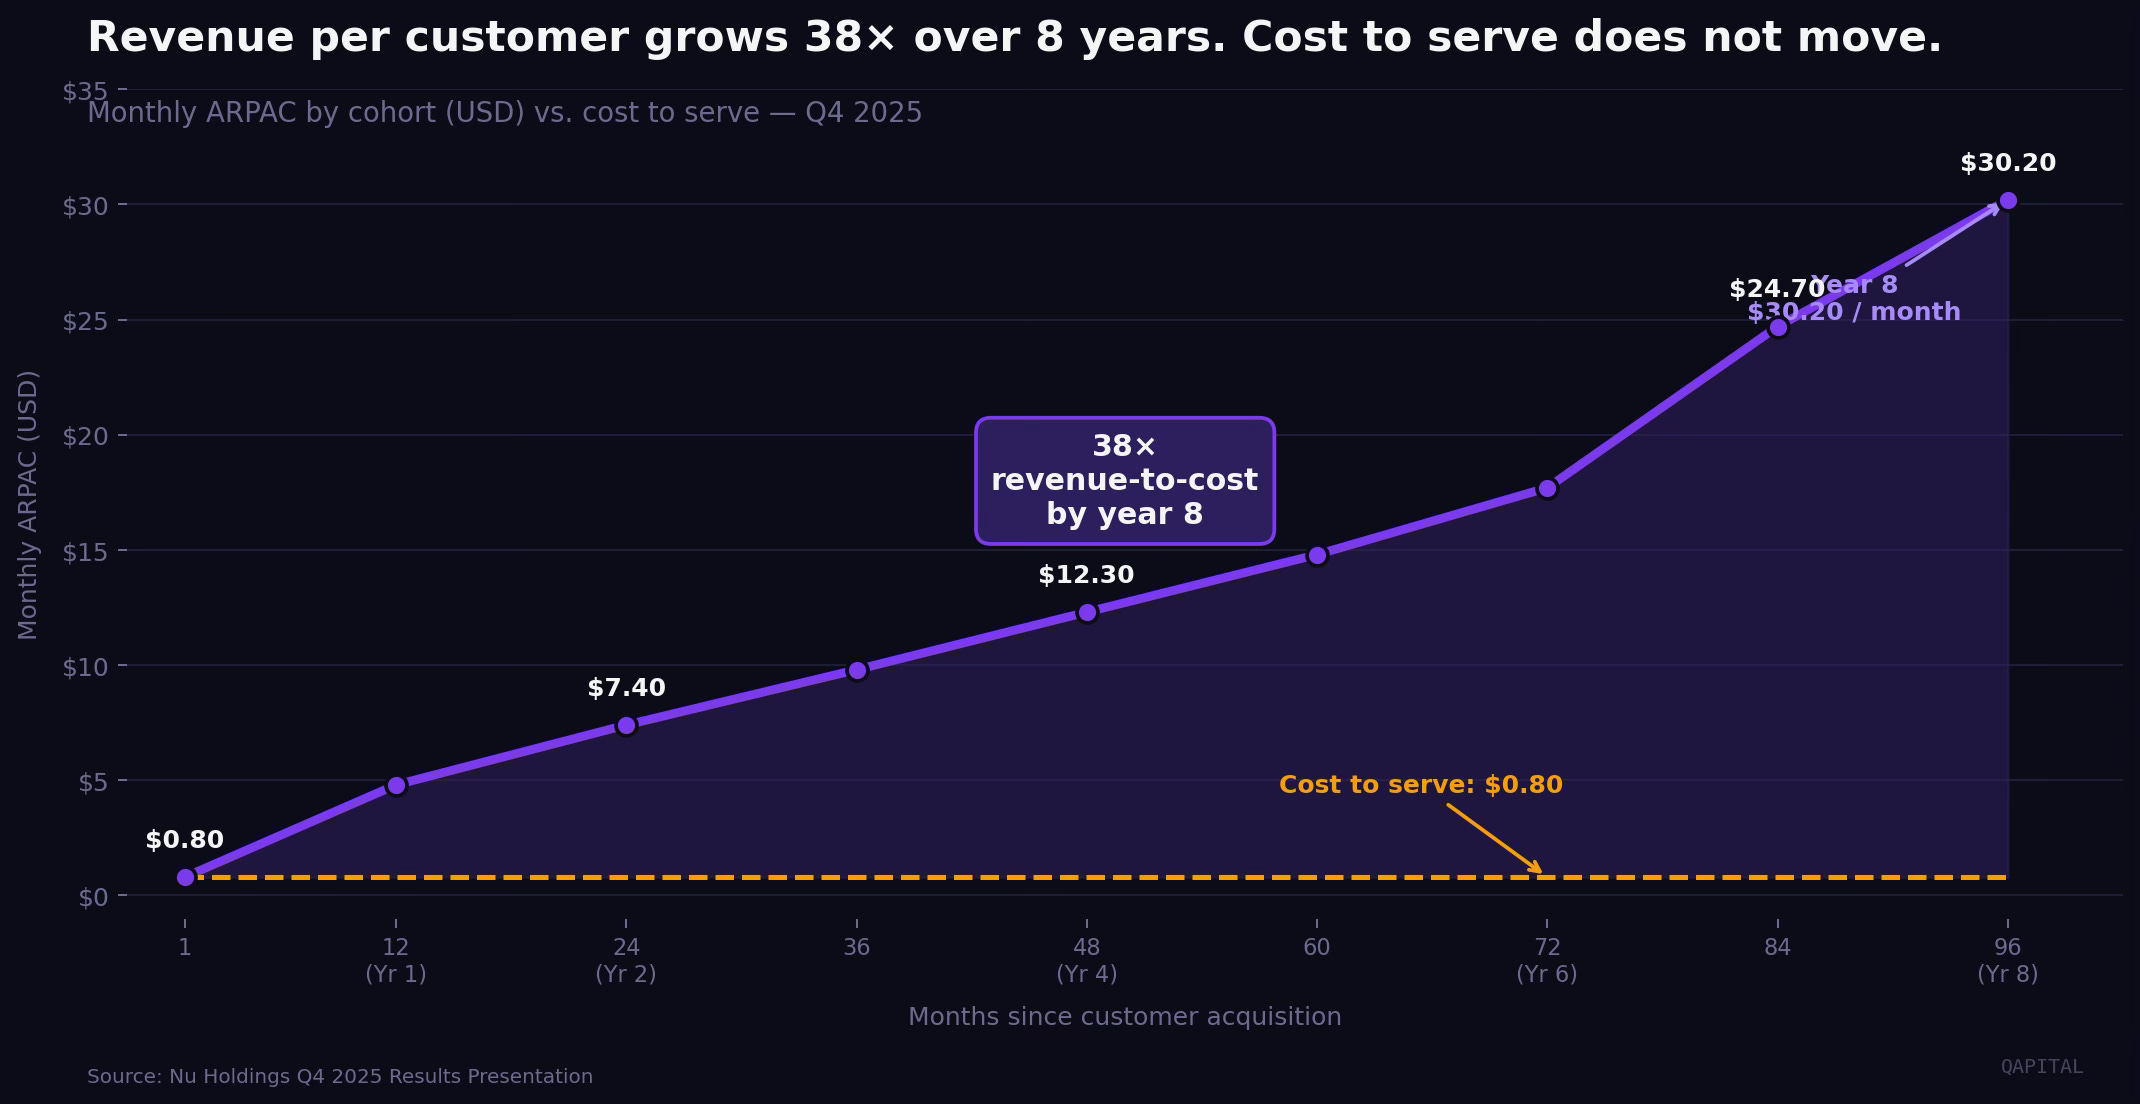
The curve does not flatten. It keeps compounding. There are two reasons.
First, as customers use Nu more, they trust it more, and they give it a greater share of their financial life. They move their salary there. They take out a personal loan. They invest through the app. They buy insurance. The product suite is the upsell, and because it lives on the same app, the friction of switching from one product to the next is minimal.
Second, Nu’s credit underwriting improves as it accumulates behavioral data. A customer who has paid their credit card reliably for two years is a different risk than a new customer. Nu can extend more credit at lower risk to established customers. Higher credit limits generate higher interest income, so ARPAC goes up while the loss rate goes down.
Against this, the cost to serve holds roughly flat at $0.80 per month regardless of how long the customer has been active. This is the moat. The variable cost does not scale with the customer’s value; the platform cost is fixed and shared across 131 million users.
Full year 2025 net income was $2,871 million on a customer base of 131 million, approximately $22 of annual net income per customer. As the cohort mix matures and international customers follow the Brazil aging curve, that number should rise materially.
Capital allocation note:Nu is currently retaining all earnings. Total equity grew from $7.6 billion to $11.3 billion in 2025, reflecting zero dividends and no buyback programme. All capital is being reinvested into Mexico and Colombia growth, US charter costs, and AI infrastructure. Book value per share at December 31, 2025 was approximately $2.35.
The Credit Risk Question: The Bear Case
Every bull case on Nu gets met with the same pushback: this is a bank lending to lower-income Brazilians at a time of high interest rates, weakening consumer credit, and BRL volatility. When the cycle turns, the NPLs will blow up.
The bear case is not wrong to ask the question. It is wrong about the answer.
NPL 15-90 days (the early warning signal) peaked at 5.1% in Q4’23, fell steadily, and reached 4.1% in Q4’25, back to the level last seen in Q4’22, at the beginning of Nu’s credit expansion cycle. It is not deteriorating. It is improving as the underwriting model matures.
NPL 90+ days (actual credit impairment) peaked at 7.0% in Q2’24 and has since stabilized at 6.6% in Q4’25. Based on management commentary and publicly available industry data, the comparable figure for Brazil’s largest banks runs in the 7-9% range. Nu appears to be outperforming local peers on credit quality while growing its book 40% year-on-year.
Coverage ratios are conservative. Nu carries credit loss allowances equal to 15.2% of total portfolio and 230.9% of NPL 90+ balances. For every $1 of non-performing loan over 90 days, Nu has $2.31 set aside in reserves. LatAm consumer banks typically run coverage ratios in the 150-200% range; Nu’s 231% sits at the high end.
The cost of credit rose in Q4’25, up 26% FXN quarter-on-quarter to $1,313 million. The risk-adjusted NIM held at 10.5% in Q4’25, within the 9.3-10.8% range of the past six quarters. There is no deterioration trend, but there is volatility quarter to quarter.
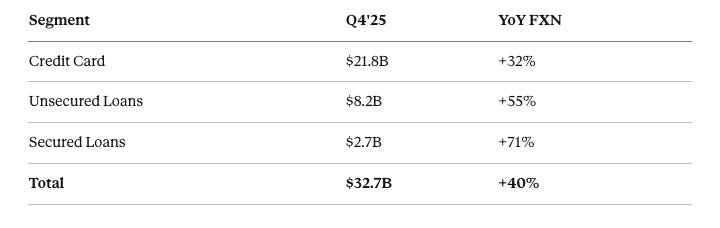
The portfolio mix is shifting in the right direction. Secured loans grew 71% FXN year-on-year. As Nu adds more secured products, the risk profile of the overall book improves, even as the headline portfolio grows 40%.
Renegotiated balances represent $3.2 billion or 9.6% of the total portfolio, down from 10.5% a year ago. The trend is improving, not deteriorating.
The FX risk is real and separate. Nu reports in USD but earns primarily in BRL, MXN, and COP. The FX-neutral (FXN) growth rate is the right lens for underlying operational performance. Investors need to be comfortable holding a LatAm FX basket to own this stock.
The Bull Case: 3 scenarios where this compounds to $18+
The bear case on Nu is well-rehearsed. The bull case is more interesting, and it does not require anything heroic to work. It requires three things that are already directionally in motion.
Scenario 1: Mexico follows the Brazil aging curve
Nu launched in Brazil in 2014. By year eight, the average Brazilian customer was generating $30.20 per month in ARPAC. Nu launched in Mexico in 2020. If Mexican customers follow the same curve with a five-to-seven-year lag, the average Mexican customer will be generating $15-20 per month by 2030. Today that figure is closer to $3-5. The difference, applied to 14 million customers (and growing), is roughly $2-3 billion of additional annualised revenue by 2030, at near-zero incremental cost.
This is not a stretch assumption. It is the base case for any business where the revenue-per-customer curve has been demonstrated in one market and the company is replicating the same model in structurally similar markets.
Scenario 2: The efficiency ratio keeps falling
At 19.9%, Nu has just broken below 20% for the first time. The operating cost base ($653 million in Q4’25) is largely fixed. Revenue ($3,274 million in Q4’25) is growing at 14% FXN per quarter. If revenue compounds at 20-25% annually and opex grows at 10-12%, the efficiency ratio reaches 16-17% by 2027. Every percentage point of improvement on a $15 billion revenue base is approximately $150 million of incremental pre-tax income.
Scenario 3: The US works
This is the smallest and least certain of the three, but it has the largest option value. The US has 50 million Hispanics, a significant portion of whom are underbanked or poorly served. Nu has a brand, a product, and now a conditional OCC charter. If the US operation reaches 5-10 million customers at even half the ARPAC of a mature Brazilian customer, the revenue contribution is $750 million to $1.5 billion annually.
You do not need all three scenarios to work for the bull case to play out. Under combined assumptions, 2028 net income approaches $6-7 billion. At 15x earnings, the equity is worth $90-100 billion, or roughly $19-21 per share. The $18+ bull case target is not heroic. It is what you get if the three things already in motion simply continue moving.
The bear case requires something to break. The bull case requires nothing to break that has not already been breaking in the right direction for three years.
The platform: 131 million customers and counting
Brazil is the core. Of Nu’s 131 million customers, approximately 113 million are Brazilian. At roughly 57% of Brazil’s adult population, Nu is no longer a challenger; it is the incumbent for a generation of Brazilians who grew up digital.
In Brazil, the growth story is no longer about customer acquisition. It is about ARPAC expansion. The average Brazilian customer is moving up the product curve: taking loans, investing, buying insurance, using Nubank as their primary financial relationship.
Mexico is the second act. Nubank launched in Mexico in 2020 and now serves 14 million customers, approximately 15% of the adult population. Mexican deposits grew to $6.3 billion in Q4’25 (+40% FXN year-on-year). The opportunity here is large: Mexico has 130 million people, a banking system even more concentrated than Brazil’s, and a smartphone penetration rate above 70%.
Colombia has 4.2 million customers and $2.5 billion in deposits. It is the smallest of the three markets, following the same model: launch the credit card first, build trust, expand into lending and savings.
Together, the three LatAm markets give Nu a population addressable market of approximately 430 million people, of whom it currently serves 131 million (30%).
The Mexico scenario (illustrative, not guidance): 14 million Mexican customers at $30/month ARPAC (the Brazil 8-year cohort level) would add roughly $5 billion of annualised revenue, approximately 30% of today’s total group revenue. This is a 2030+ scenario and depends on Mexican customers following the Brazil aging curve, which is not guaranteed. Treat it as directional, not as a forecast.
The US Expansion: The most important slide nobody is talking about
Buried in the Q4’25 results presentation, under 2025 strategic priorities, is the following company-disclosed milestone: Nu obtained conditional approval from the OCC for a national bank charter (Nubank N.A.) in January 2026. Status as reported by management: In Progress. Final authorization from the OCC remains pending; conditional approval is a regulatory step, not a guarantee.
This is still a significant event that has received less attention than it deserves.
The OCC (Office of the Comptroller of the Currency) is the US federal banking regulator. A national bank charter is the most powerful banking license in the US; it supersedes state-by-state money transmitter licenses and allows a full-service bank to operate across all 50 states. The OCC does not grant these freely. Conditional approval signals that Nu has cleared the initial regulatory hurdle, though there is precedent for conditions stretching timelines by 12-18 additional months.
The US strategy is not to replicate the Brazilian playbook wholesale. Nu is not going to disrupt Chase. The target market is different: the US has approximately 50 million Hispanics, of whom a disproportionate number are underbanked or hold accounts with fees and friction similar to what Nubank attacked in Brazil.
The go-to-market will likely begin with the Conta Global product: a global account that allows customers to hold, transfer, and spend in multiple currencies. This positions Nu as a cross-border financial hub for the LatAm diaspora in the US, covering remittances, family transfers, and dollar savings.
US scenario sizing (illustrative): At a conservative $150-200 of annual ARPAC per US customer, 5 million US customers would represent approximately $750 million to $1 billion of incremental annual revenue. The real value is optionality: if Nu demonstrates the model works in the US, the addressable base and ARPAC ceiling both expand.
The Behavioral Lens: Why the purple card works when the banks don’t
Nu Holdings is routinely analyzed through a fintech lens: lower costs, better UI, digital-native. This misses the more interesting explanation. Three behavioral dynamics drive Nu’s customer economics in ways that a purely financial analysis cannot capture.
1. Status Object Bias
People attach disproportionate emotional value to branded objects that signal group membership or values. Traditional banks made banking intimidating on purpose. The branches were designed to signal authority. The opaque fee structures were not accidents; they were features. Confusion keeps customers passive, and passive customers do not shop around.
Nu dismantled this deliberately. The purple card arrived in a minimalist black box. Customer service responded in conversational Portuguese, not bureaucratic script. The result: customers became engaged. Nu had a waitlist of millions before national launch because scarcity was engineered into the rollout. The card became a social object, something that signalled you had escaped the old system.
2. Status Quo Bias
Traditional banks create friction at the point of service. Nu creates friction at the point of leaving. Your entire financial history lives in the app. Your recurring payments run through it. Your savings are there. The product deepening (loans, insurance, investment) increases switching costs without the customer noticing them accumulate. This is not inertia through laziness; it is inertia through accumulated switching cost, and it is reflected directly in the cohort curve.
3. Complexity Aversion
Brazilian banking was deliberately complex. Nu’s radical transparency (no hidden fees on the core product, plain-language billing, real-time balance visibility) reduced the cognitive load of managing money. Customers who previously avoided engaging with their finances became daily active users. Engagement is the precondition for cross-sell. Transparency built engagement.
Understanding this behavioral architecture is understanding why the cohort curve keeps compounding. It is not just cross-sell. It is emotional lock-in built into the product from day one.
The Financials: The numbers in full
Full Year 2025 (IFRS)
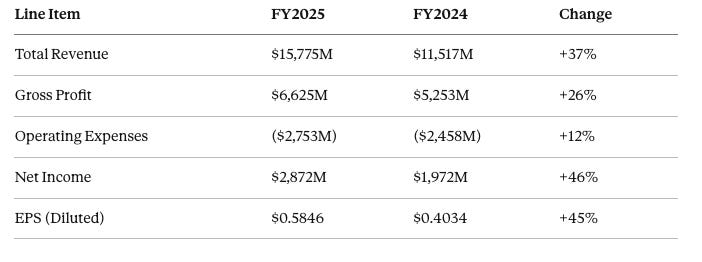
Source: IFRS consolidated financial statements, December 31, 2025.
Q4 2025 — Managerial P&L (non-IFRS)
Note: Managerial P&L segments are derived from IFRS financials via a defined set of operational reclassifications and tax-equivalency adjustments. Net income is identical under both frameworks; the segments differ.
Managerial P&L framework was formally introduced in Q4 2025; Q4’24 comparative segments are not available on a like-for-like basis.
Key Ratios
Balance Sheet (December 31, 2025)
Credit Portfolio
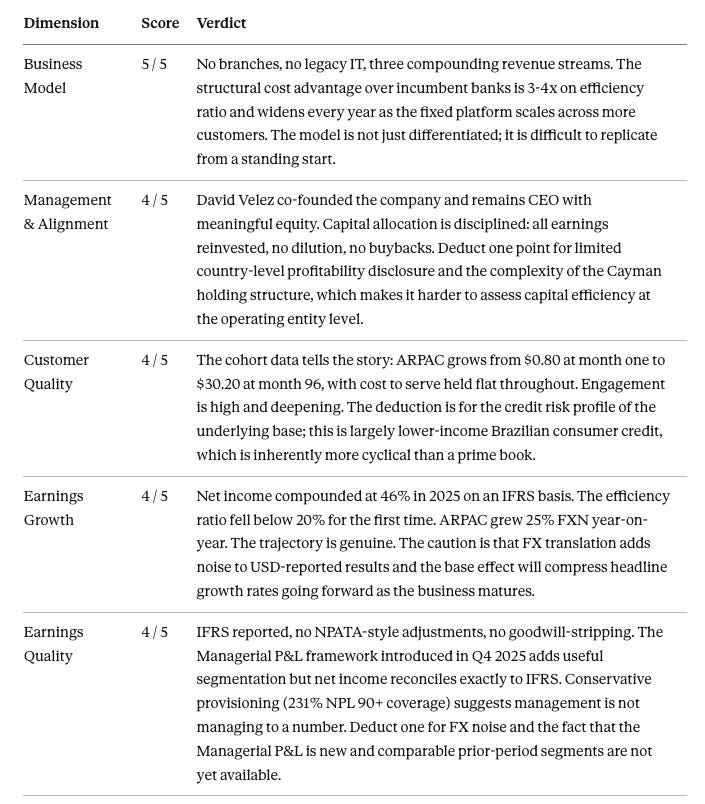
The Quality Scorecard
Eight dimensions. Each scored 1-5. The analysis above justifies every number.
Overall: 32 / 40
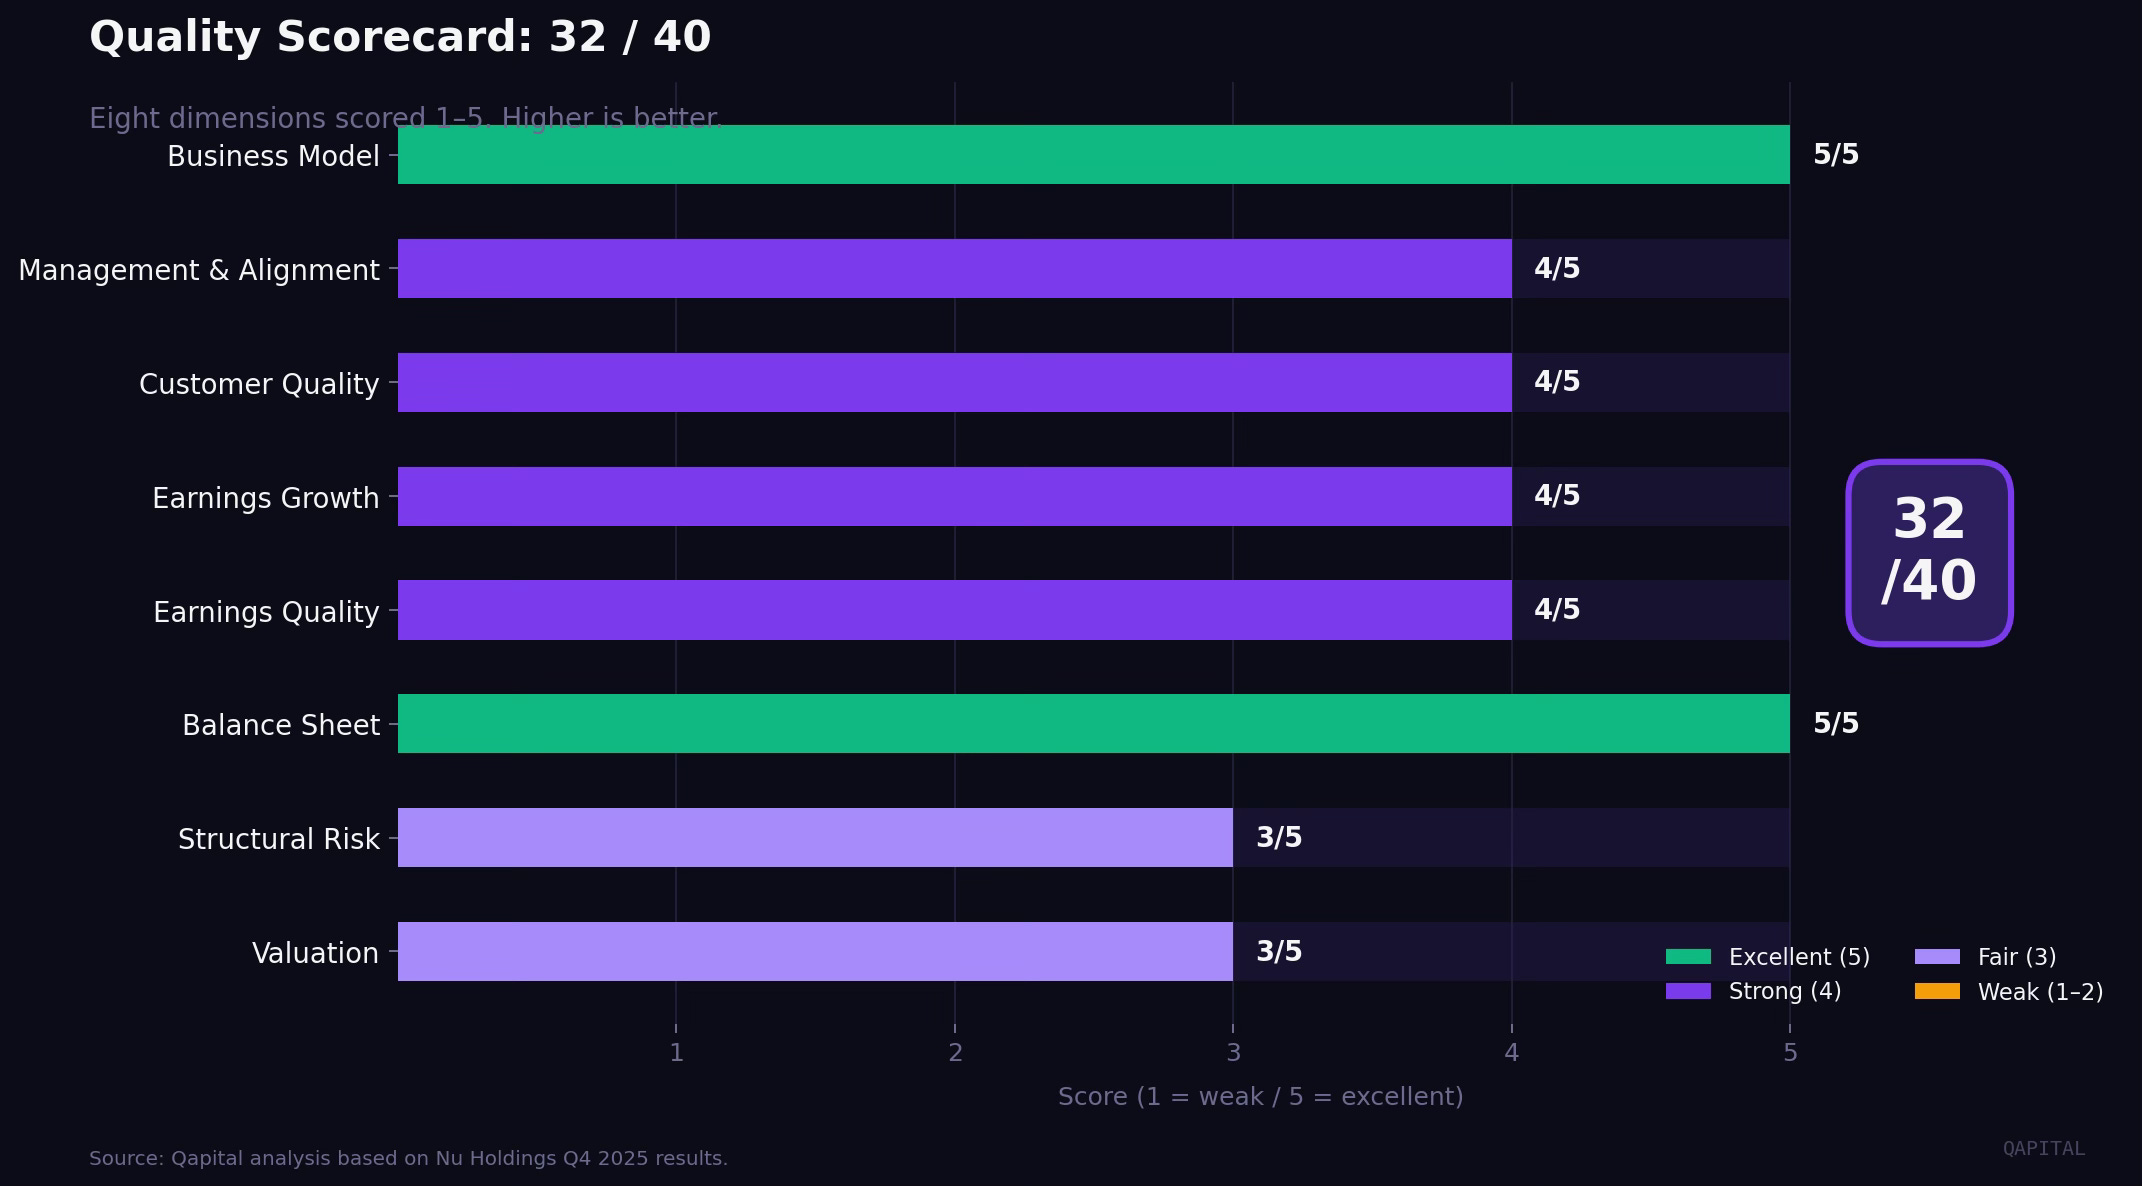
A genuinely high-quality business at a fair price. The scorecard would move toward 35+ if Mexico ARPAC starts tracking the Brazil cohort curve and the US charter converts to a full launch. It would move toward 28 if NPL 15-90 deteriorates past 5% or FX creates another year of USD-reported earnings headwinds.
Keep reading with a 7-day free trial
Subscribe to Qapital to keep reading this post and get 7 days of free access to the full post archives.